What UX competitor analysis really tells you (2026)
Most teams open a competitor's product hoping to copy what works. That's the wrong instinct. The point of UX competitor analysis isn't to clone someone else's screens — it's to see, in concrete terms, where users get stuck (on their product and on yours), so you can decide what to fix first.
The stakes are real: roughly 88% of users won't come back after a poor experience, and 32% leave after a single bad one. Teams that turn competitor insight into action — like Dropbox cutting its support load by ~40% — convert that research into retention and revenue, not just a prettier interface.
This 2026 guide breaks down seven tools that help you analyze competitor UX, find the gaps, and improve your own product. Quick overview first, then how to choose one, then each tool in detail.
Quick Overview of Tools:
- Userlytics: Conduct usability tests with 2M+ testers, benchmark UX across 18 attributes, and use AI-powered insights to identify issues.
- Semrush: Analyze competitor traffic, audience behavior, and SEO to connect marketing and UX strategies.
- UXCam: Focus on mobile UX with session replays, heatmaps, and funnel analysis to detect friction points.
- Figma: Collaborate on design, prototype competitor-inspired user flows, and integrate feedback in one place.
- Contentsquare: Use AI-driven behavioral analytics to track user interactions and compare against industry benchmarks.
- Optimal Workshop: Study navigation structures with card sorting, tree testing, and first-click analysis.
- UXTweak: Combine usability testing, session recordings, and heatmaps to evaluate your product alongside competitors.
Why It Matters:
- 32% of customers leave after one bad experience.
- Tools like these can improve conversion rates by 200–400% and reduce drop-offs by addressing UX challenges.
- Leveraging competitor insights ensures your product meets rising user expectations and stays competitive.
How to choose a UX competitor analysis tool
Choosing the right UX competitor analysis tool can make or break your research. Each platform has its own strengths, so the trick is matching features to your actual question and budget — not buying the one with the longest feature list.
Start from the question you're trying to answer:
- Where do users drop off? → session replay & funnels (UXCam, Contentsquare)
- How does our navigation compare? → information-architecture testing (Optimal Workshop)
- Why do competitors rank or convert better? → traffic & keyword intelligence (Semrush)
- How does our usability score against benchmarks? → moderated/unmoderated testing (Userlytics, UXTweak)
- How do we turn findings into design? → Figma
Choosing the right UX competitor analysis tool can make or break your research efforts. Each platform comes with its own strengths, so it’s important to match those features with your team’s goals and budget.
| Tool | Core Features | Best Use Cases | Key Benefits | Limitations | Starting Price |
|---|---|---|---|---|---|
| Userlytics | Usability testing, ULX® Benchmarking Score, AI insights, global participant panel | Enterprise SaaS, agencies, in-depth benchmarking | Access to 2M+ pre-screened testers, fast results, and detailed UX evaluations across 18 attributes | Can be overwhelming for smaller teams new to UX research | $34/session |
| Semrush | SEO analysis, traffic tracking, keyword research, content gap analysis | Digital marketing teams, organic growth strategies | Offers market intelligence and competitor keyword insights | Lacks direct UX research features; data is estimated rather than exact | $139.95/month |
| UXCam | Mobile analytics, heatmaps, session recordings, user journey mapping | Mobile apps, SaaS with mobile components | Provides detailed app insights, identifies performance issues, and supports stakeholder reporting | Primarily focused on mobile, with limited web analytics | Tiered pricing |
| Figma | Real-time design collaboration, prototyping, design systems, interface audits | Product design teams, rapid UI development | Enables real-time team collaboration, fast prototyping, and extensive integrations | Not designed for research; lacks analytics capabilities | Freemium model |
| Contentsquare | Session replay, AI-driven heatmaps, conversion funnel analysis, friction detection | SaaS, e-commerce, enterprise-level insights | Delivers advanced behavioral analytics and conversion optimization tools | Pricey for smaller teams and requires significant setup | Custom enterprise pricing |
| Optimal Workshop | Card sorting, tree testing, surveys | IA specialists, navigation optimization | Simple to use, focused on IA analysis, and provides clear usability insights | Limited in behavioral analytics and broader feature scope | Subscription plans |
| UXTweak | Usability testing, prototype testing, competitive benchmarking | Startups, small teams, budget-conscious organizations | Affordable, user-friendly, and offers a comprehensive testing suite | Lacks advanced enterprise features and has a steeper learning curve for beginners | €92/month |
This table highlights the differences in functionality, pricing, and scalability across these tools. For example, Userlytics stands out for enterprise-grade benchmarking, making it a great choice for comprehensive competitive studies. On the other hand, UXCam is tailored to mobile app analytics, making it indispensable for teams focused on improving app performance.
Pricing considerations are equally important. While UXTweak starts at $80 per month and is ideal for smaller teams, Contentsquare requires custom enterprise pricing that can stretch into thousands, making it a better fit for larger organizations. Similarly, Userlytics offers unlimited seats on its enterprise plan, providing scalability for big teams, whereas Optimal Workshop is better suited for focused IA projects and may need to be paired with other tools for a broader analysis.
When selecting a tool, focus on your primary UX research goals. For instance, if you’re trying to understand why competitors rank higher in search results, Semrush provides actionable insights through keyword gap analysis. If your goal is to identify why users abandon your mobile app, UXCam can pinpoint those drop-off points with session recordings. This comparison serves as a guide to help you zero in on the tool that aligns best with your UX competitor analysis strategy.
New for 2026: AI attention prediction. A newer category is worth a look alongside the seven above. Tools like Attention Insight use AI trained on real eye-tracking data to predict where people look on a screen — so you can drop a competitor’s page next to yours and compare attention in seconds, without recruiting testers. It won’t replace real usability testing, but it’s a fast first read when you’re benchmarking visual hierarchy against a rival.
AI UX competitive analysis: using AI to compare UX faster
A newer layer on top of these tools is AI UX competitive analysis: using large language models to do the slow first pass for you. Practical uses that work today: paste competitor onboarding screenshots into an LLM and ask it to describe the flow step by step; feed it public reviews of rival products and ask where users complain most; ask it to draft a heuristic comparison of two signup flows that a designer then verifies. What used to take a research sprint now takes an afternoon.
Two rules keep it honest. First, treat AI output as hypotheses. A model can compare UX patterns it can see, and it can also invent ones it cannot; check its claims against session recordings or test results from the tools above before acting on them. Second, keep the goal narrow: you are looking for the friction competitors have already solved and you have not, because that gap is usually the cheapest place to win. You can see how Equal turns this kind of analysis into shipped product changes in its case studies.
One caution before you buy anything. A tool will hand you a long list of friction points. That list isn't a plan. The hard part — the part that actually moves retention — is deciding which one problem to fix first. If you're staring at twenty issues and unsure where to start, that's a prioritization problem, not a tooling one. Here's how to find the bottleneck that's really slowing your product.
1. Userlytics
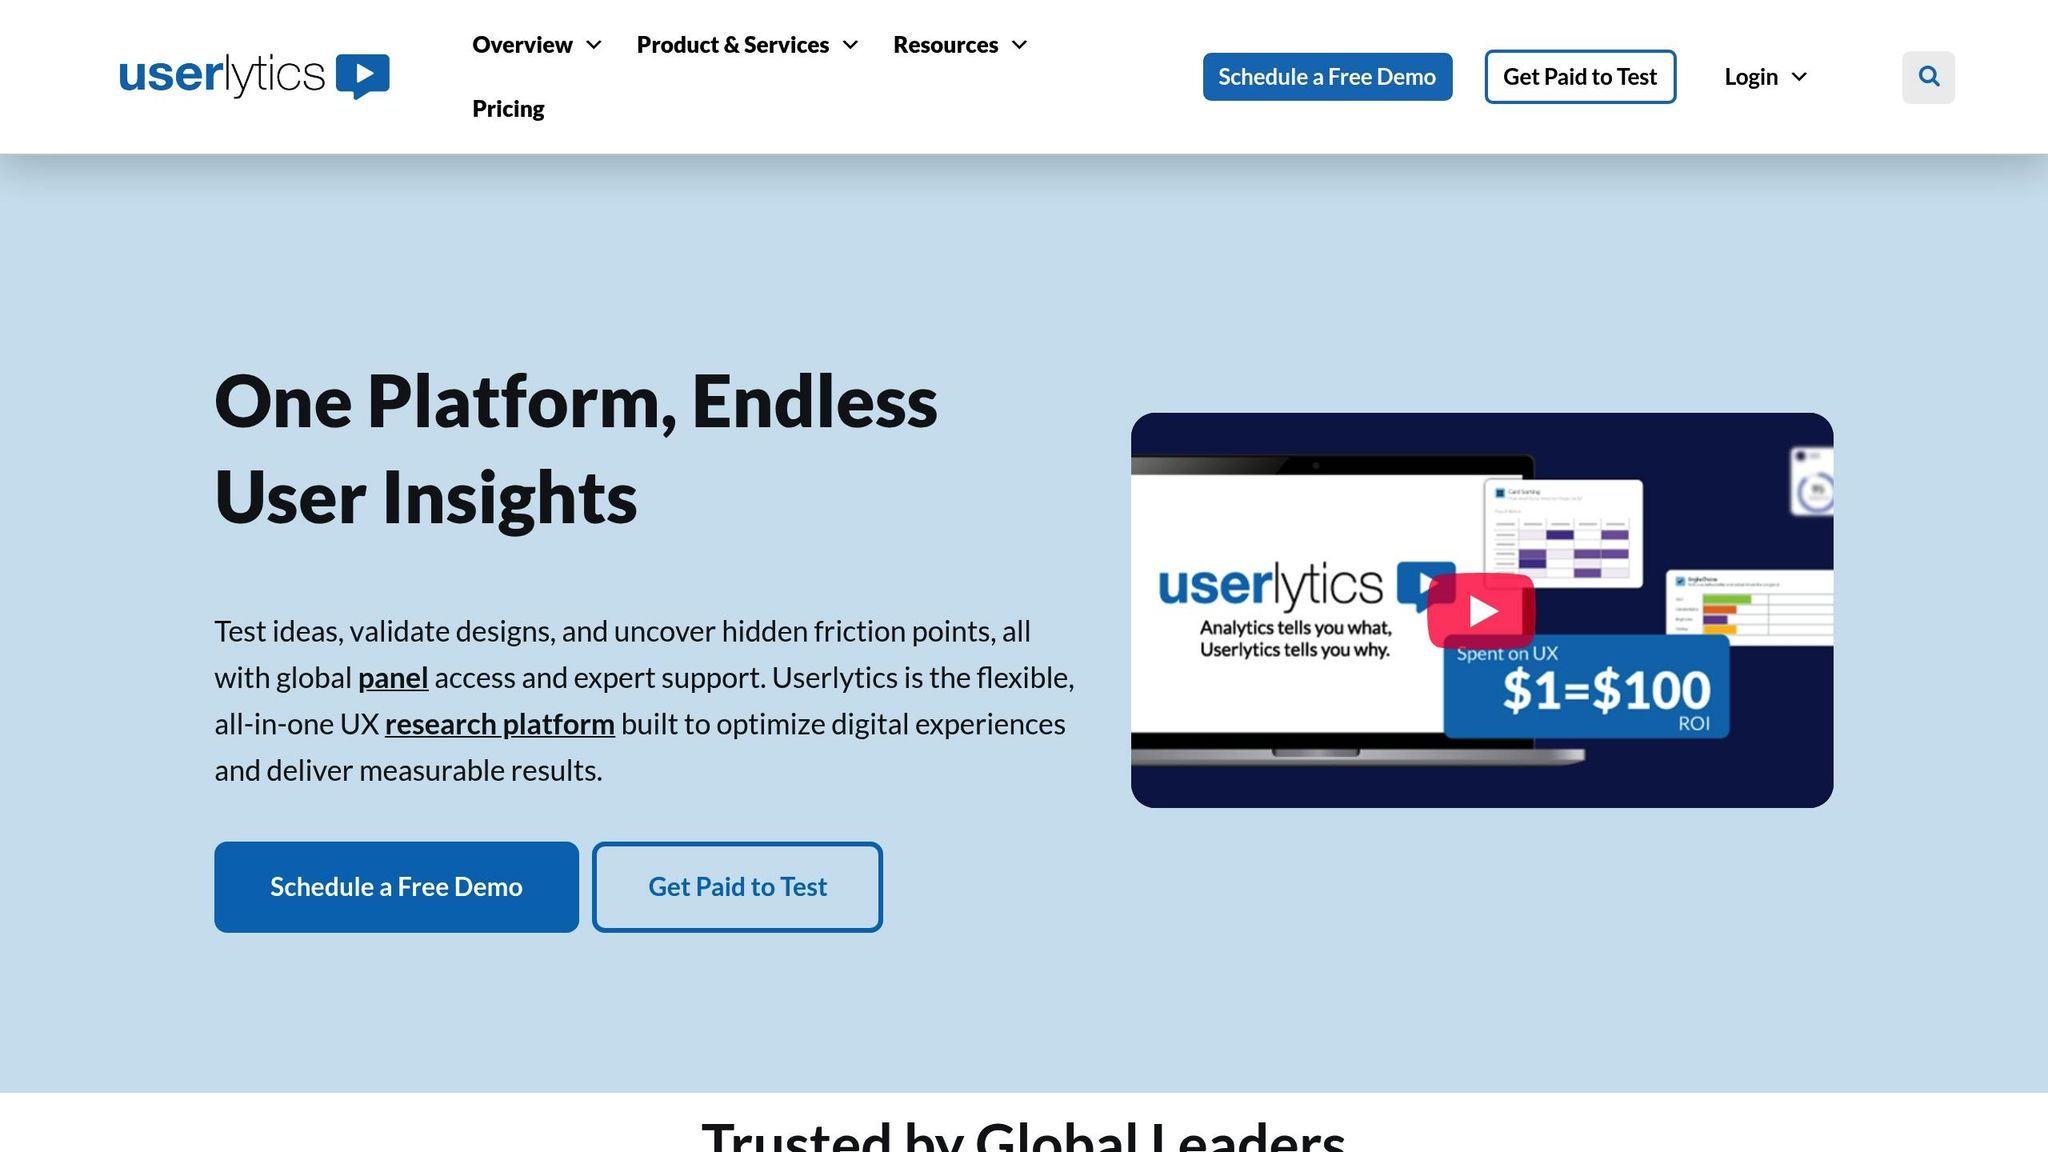
Userlytics simplifies competitor analysis by showing how real users interact with both your product and your competitors' platforms. With access to over 2 million pre-screened testers worldwide, this UX research tool provides the insights you need to see how your user experience compares to others in your industry.
Competitive Benchmarking Capabilities
One of Userlytics' standout features is its ULX® Benchmarking Score. This proprietary metric evaluates UX performance across 18 attributes and 8 constructs, offering a clear way to measure how your product stacks up against competitors. You can set up parallel usability tests, assigning identical tasks to users on both your platform and competitors' products. This allows you to compare key metrics like task completion rates, time spent on tasks, and overall user satisfaction.
For example, a SaaS company used Userlytics to test its onboarding process against competitors. They discovered a 40% higher task failure rate on their platform. After redesigning their onboarding flow, they reduced drop-offs by 28% within three months.
Usability Testing and User Behavior Insights
Userlytics goes beyond basic testing by recording user interactions through screen captures, audio, and webcam footage. This approach doesn’t just show what users are doing - it uncovers the reasons behind their successes or struggles. Whether you prefer moderated testing for deeper feedback or unmoderated testing for faster results, the platform offers both options to suit your needs.
Its AI-powered video analysis makes reviewing sessions much faster. Instead of manually watching hours of recordings, you get automated highlights that pinpoint critical usability issues and user reactions. Combined with detailed behavior analysis, these insights help you understand your users on a deeper level.
Data-Driven Design Improvement Features
Userlytics also provides advanced tools like heatmaps, clickstream analysis, and session recordings to identify interaction trends and prioritize improvements. Its AI-powered sentiment analysis quickly identifies users' emotional responses, helping you focus on what matters most.
The platform supports global research with session transcriptions in 36 languages. Plus, it integrates smoothly with design tools like Figma, Adobe XD, and Sketch, enabling teams to turn research findings into actionable design updates without disrupting their workflow.
With enterprise plans starting at $34 per session and unlimited seats included, Userlytics delivers a cost-effective way to gather competitive insights and refine your UX strategy.
2. Semrush
Semrush goes beyond marketing - it’s a powerhouse for UX competitor analysis, providing concrete data on traffic patterns, user behavior, and digital strategies. Trusted by over 10 million marketing professionals globally, Semrush connects the dots between marketing insights and user experience optimization. Instead of relying on guesswork, it gives you access to detailed data that reveals what drives your competitors' success.
Competitive Benchmarking Capabilities
With Semrush’s Traffic Analytics tool, you can compare up to 200 competitor websites side-by-side. This feature uncovers user sources and engagement metrics, offering a clear picture of how competitors perform and helping you set precise UX benchmarks.
The Market Explorer feature delivers a high-level view of your competitive landscape. It highlights market share, audience demographics, and growth trends that can directly shape your UX strategy. These insights are invaluable when identifying areas for improvement, such as responsive design tweaks or mobile optimization.
Semrush users report identifying UX and SEO issues 30% faster compared to manual methods. This efficiency allows teams to quickly spot competitor innovations and adjust their own strategies to enhance user experience.
Data-Driven Design Improvement Features
Semrush doesn’t stop at benchmarks - it helps you turn insights into action. The Site Audit tool identifies slow load times and mobile usability issues that could be hurting your conversions. Armed with this data, you can make targeted changes to improve site performance.
Its keyword gap analysis sheds light on the content and UX elements that truly connect with users. By comparing engagement metrics and conversion rates, teams can focus on design updates that drive growth and boost user retention.
The EyeOn tool keeps you ahead of the curve by monitoring competitor website updates and new content launches. With real-time alerts, your team can quickly adapt UX strategies to stay competitive in a shifting market.
Semrush also offers customizable dashboards and exportable reports that visualize traffic trends, user behavior, and engagement metrics across competitors. These visual tools make it easier for teams to share findings with stakeholders and back UX investments with data-driven recommendations.
3. UXCam
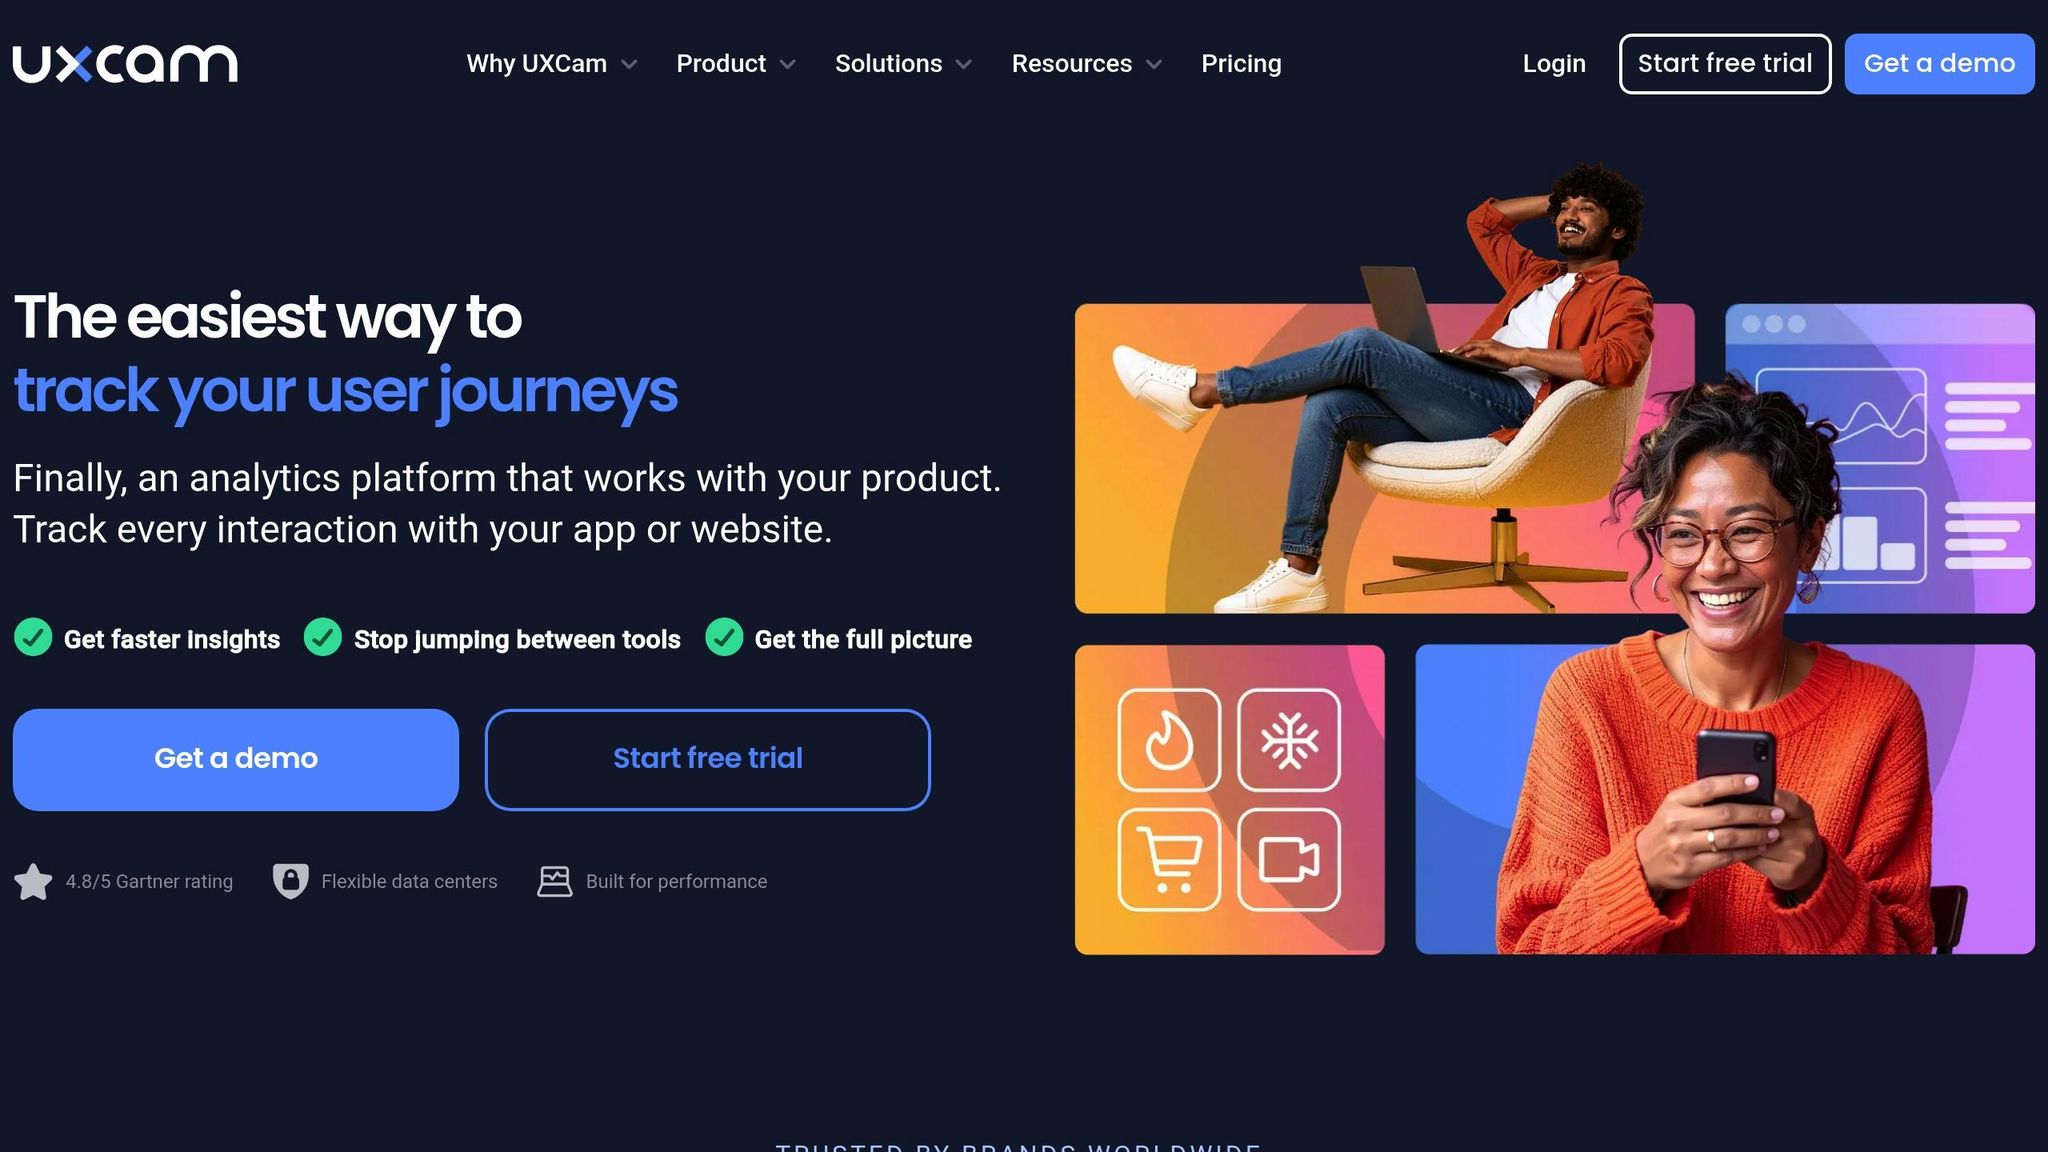
UXCam records user interactions in real time, offering a clear view of why users behave the way they do through session recordings and heatmaps. Designed with a mobile-first approach, this tool is especially useful for SaaS teams. After all, 52% of users admit that a poor mobile experience makes them less likely to engage with a brand.
Usability Testing and Understanding User Behavior
With UXCam's session replay feature, product managers can uncover where users face confusion, detect frustration (like rage taps), and identify navigation challenges. Heatmaps and funnel analysis provide insights into which features grab attention and where users drop off.
What’s more, UXCam automatically tracks detailed user interactions. This allows teams to segment users into groups - such as new users, power users, or those from specific acquisition channels - and analyze how each group interacts with the app. These insights are invaluable for refining designs and improving user experiences.
Features That Drive Data-Informed Design
UXCam’s analytics dashboard transforms user behavior data into actionable insights. Teams can track how design updates impact conversion rates, retention, and user satisfaction - removing the guesswork from UX decisions and justifying design investments with clear metrics.
The platform also helps benchmark user journeys by tracking session duration, feature adoption, and completion rates. For instance, if your onboarding completion rate is below industry standards, UXCam can pinpoint the exact friction points that need attention.
Collaboration across teams is simplified with shared dashboards and annotated session replays. Product managers, designers, and developers can collectively analyze user behavior, discuss pain points, and align on solutions. Plus, UXCam integrates with popular project management and analytics tools, making it easy to export insights into existing workflows. This ensures user feedback is effectively translated into product improvements.
4. Figma
Figma is a standout tool for collaborative design and prototyping, offering SaaS teams a fresh approach to competitor analysis. By weaving competitor insights into the design process, it empowers teams to build a more data-informed user experience through real-time collaboration and rapid prototyping.
Competitive Benchmarking Capabilities
Figma simplifies visual competitor analysis by allowing teams to import screenshots or recreate competitor interfaces directly within the platform. This makes it easy to set up side-by-side comparisons of design files, UI components, and user flows, helping teams identify patterns in layout and navigation. For instance, product teams can replicate competitor onboarding flows to spot friction points and uncover areas to enhance their own user experiences. These tools make it possible to benchmark design strategies against competitors in real time, laying the groundwork for meaningful, collaborative design iterations.
Collaboration and Prototyping Tools
Figma’s real-time collaboration is one of its strongest features. Designers, product managers, and developers can work on the same file simultaneously, eliminating delays caused by back-and-forth communication. Its prototyping tools enable teams to quickly create alternative user flows, share interactive prototypes via simple links, and collect feedback through built-in commenting. This streamlined process makes it easier to analyze and refine competitor-inspired UX ideas.
Tools for Data-Driven Design
While Figma doesn’t come with built-in analytics, its robust plugin ecosystem bridges that gap. Plugins such as FigJam, Stark, Maze, and UserTesting bring user feedback, accessibility insights, and performance metrics directly into the design process, enabling teams to make iterative improvements more efficiently.
As noted by the Interaction Design Foundation, Figma is "the go-to tool for teams needing to rapidly iterate, benchmark, and prototype against competitors", especially in fast-paced SaaS industries.
Thanks to its cloud-based framework, insights from competitive analysis sessions are instantly accessible to everyone on the team. This fosters a mindset of continuous improvement, which is essential when competitors keep shipping.
sbb-itb-f0bf0cc
5. Contentsquare
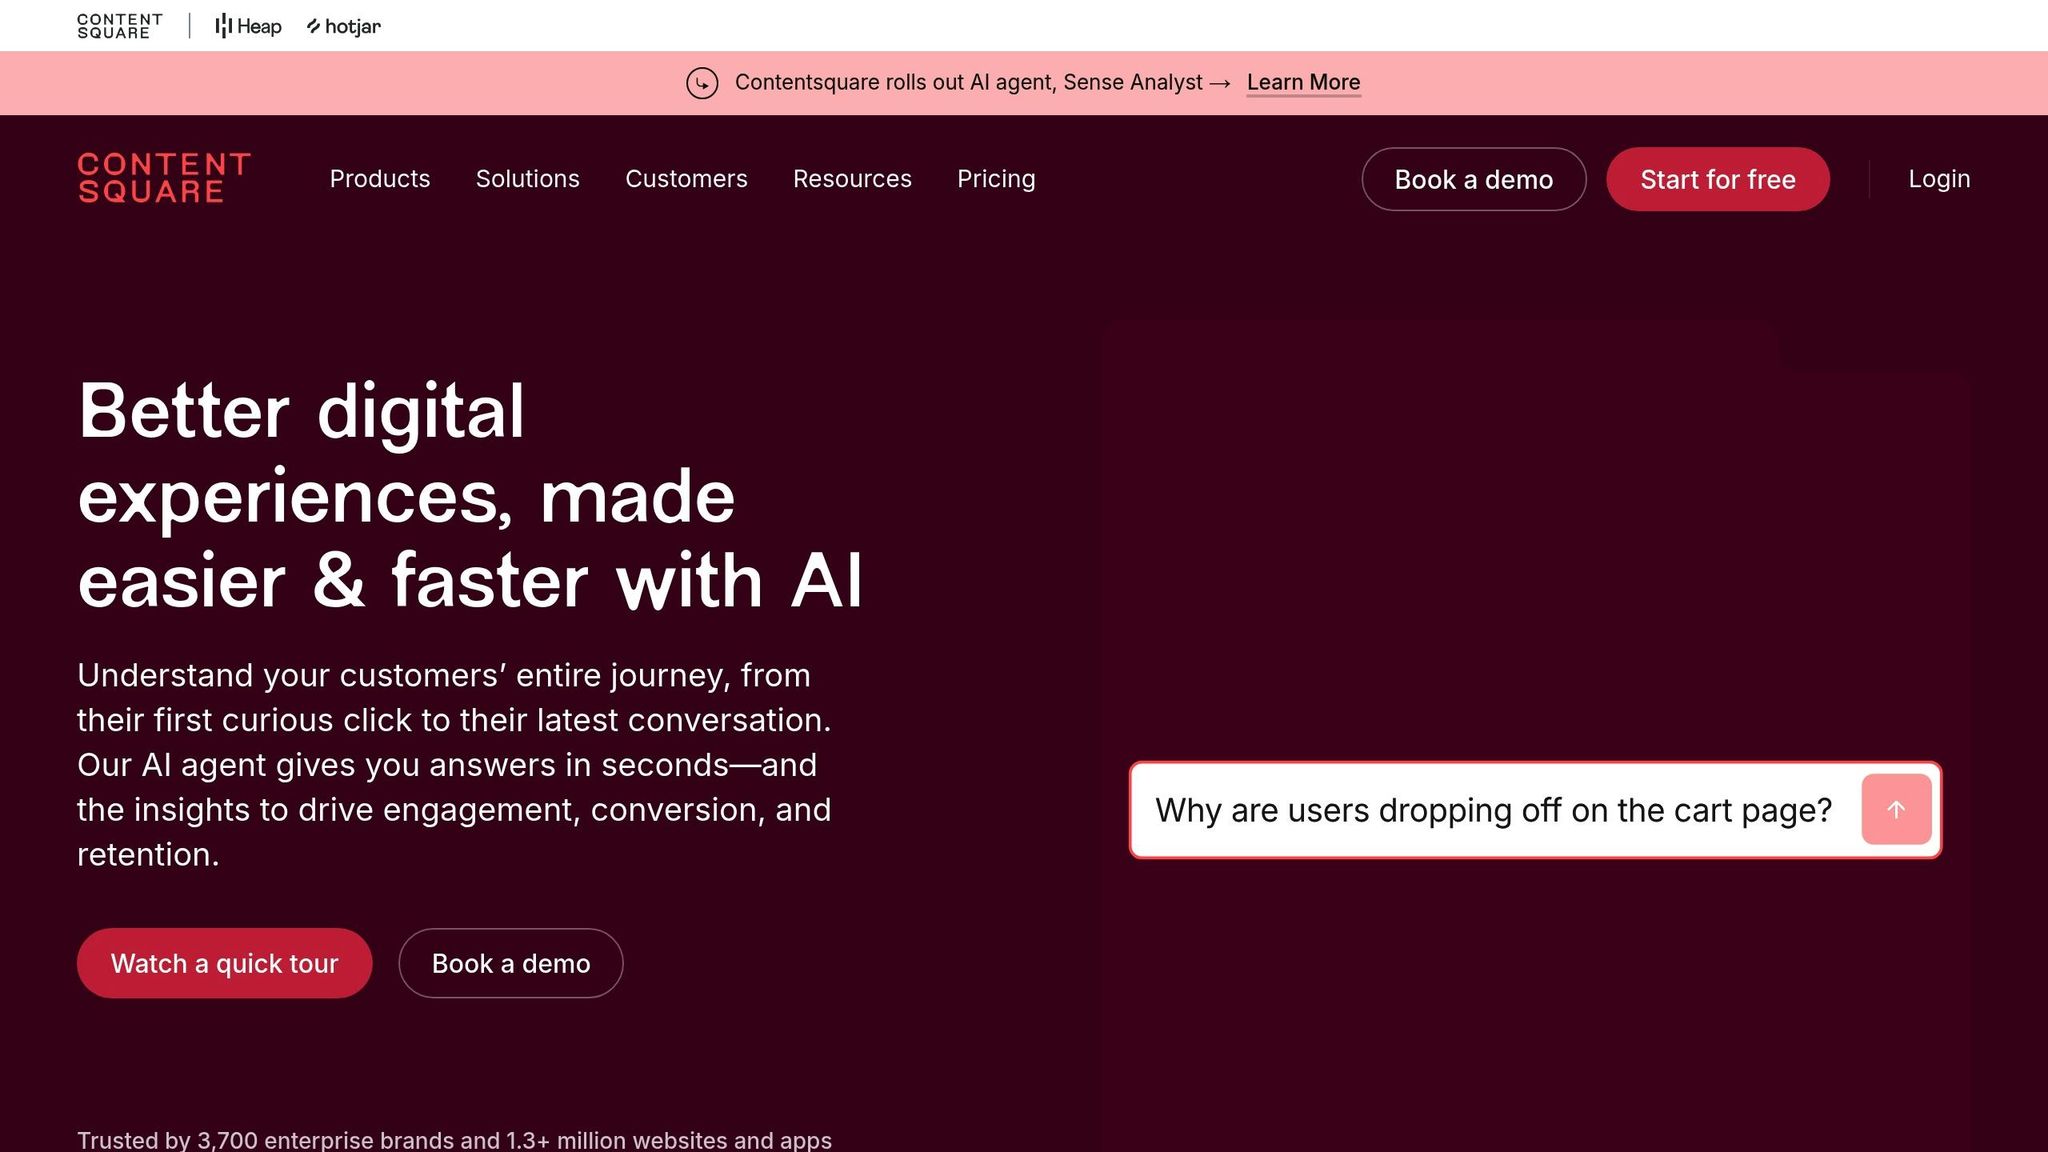
Contentsquare reshapes how SaaS and enterprise teams tackle competitive UX analysis by blending behavioral data with industry benchmarks. Instead of just reporting user actions, it digs deeper to explain why users behave differently across competitors. This deeper understanding helps teams refine user experiences and close performance gaps, making it a go-to tool for driving growth.
Competitive Benchmarking Capabilities
With a staggering dataset of over 1.4 trillion interactions per month, Contentsquare’s competitive benchmarking offers a unique edge. By using anonymized and aggregated data, teams can measure key metrics like engagement, conversion funnels, navigation habits, and even nuanced behaviors like hesitation time and error clicks. These insights are then compared against industry standards and competitors, offering a clear picture of where improvements are needed.
Usability Testing and User Behavior Insights
Contentsquare provides real-time insights into user struggles through tools like session replay and heatmaps. It tracks interactions often missed by traditional analytics, such as clicks, hesitations, rage taps, and scrolling behaviors. These features help teams pinpoint friction points that could lead to user drop-offs. A great example of this is Walmart’s Q2 2024 checkout analysis using Contentsquare. They identified a 17% drop-off on the payment page. After making targeted interface changes, they boosted checkout completion rates by 22% in just three months.
Data-Driven Design Improvement Features
Contentsquare’s AI-powered analytics engine takes the guesswork out of UX optimization. It automatically identifies anomalies and highlights opportunities, saving teams from hours of manual analysis. For instance, if users frequently miss an important button, the platform not only flags the issue but also calculates the potential revenue impact and suggests fixes. In January 2025, BMW used these tools to enhance their online vehicle configurator. By acting on benchmarking and journey analysis data, they achieved a 15% increase in completed configurations and a 12% rise in lead generation. Customizable dashboards also allow teams to monitor progress, with some reporting conversion rate improvements of up to 30%.
Contentsquare consistently earns high praise from industry analysts, with an average rating of 4.7/5 on platforms like G2 and Capterra. For teams committed to staying ahead in competitive UX analysis, it provides the actionable insights needed to make smarter design decisions. These capabilities make it a key player in the UX analytics space, paving the way for exploring even more tools to enhance competitive analysis.
6. Optimal Workshop
Optimal Workshop takes a unique approach to UX competitor analysis by diving deep into the structure of information architecture and navigation. Unlike other tools that primarily monitor surface-level interactions, this platform focuses on understanding how users think and organize information. For SaaS and enterprise teams, this means gaining the kind of insights that can help them outpace competitors where it truly counts - by delivering better user experiences.
Competitive Benchmarking Capabilities
One of Optimal Workshop’s standout features is its ability to conduct parallel studies on your product and your competitors’ interfaces. Tools like Treejack (for tree testing), Chalkmark (for first-click analysis), and OptimalSort (for card sorting) allow teams to measure task success rates, completion times, and user feedback across platforms. This method provides a clearer picture of where competitors are excelling - or falling short - beyond what traditional analytics can reveal.
These benchmarks serve as a foundation for uncovering deeper insights into user behavior and performance gaps.
Usability Testing and User Behavior Insights
Benchmarking can highlight performance disparities, but understanding why those gaps exist requires a closer look at user behavior. With tools like Chalkmark and Treejack, Optimal Workshop captures detailed user interactions, including click patterns, navigation paths, and task completions on both your product and competitors’ platforms. These insights shed light on critical friction points, such as areas of confusion or moments where users abandon tasks.
The platform is particularly effective at identifying navigation errors and misclick trends, helping teams pinpoint exactly where users struggle. By comparing how users attempt the same tasks across different interfaces, teams can zero in on specific design elements that either aid or hinder user success.
Data-Driven Design Improvement Features
Optimal Workshop’s dashboards bring everything together, combining quantitative metrics like task success rates and time-on-task with qualitative feedback from integrated surveys. This dual approach allows teams to identify navigation issues and speed up design iterations by as much as 30%.
Collaboration is also built into the platform. Team members can design studies, review results, and annotate findings within a shared dashboard. This ensures that insights from competitor analysis are accessible to everyone - from designers to product managers to developers. With these actionable insights, teams can work together to implement design improvements quickly and effectively.
Collaboration and Prototyping Tools
To bridge the gap between research and design, Optimal Workshop integrates with tools like Figma and Sketch. This makes it easy for teams to turn research findings into prototypes and test them against the same benchmarks used in competitor analysis.
With over 350,000 UX professionals using the platform worldwide, Optimal Workshop ensures that insights don’t stay siloed. Instead, they become shared knowledge that drives coordinated efforts across product teams, helping everyone work toward a common goal: creating better user experiences.
7. UXTweak

UXTweak wraps up our list as a platform that brings together a variety of UX research tools into one cohesive system. It combines usability testing, session recordings, heatmaps, and surveys into a single workflow, making it particularly useful for thorough competitor analysis.
Competitive Benchmarking Capabilities
One of UXTweak's key strengths is its ability to directly compare your product's performance against competitors through parallel usability tests. It evaluates metrics like task success rates, time on task, error frequency, and user satisfaction scores. This head-to-head comparison provides actionable, data-driven insights into how your product stacks up. Plus, it supports live website and prototype testing without requiring any code changes, making it easier to identify areas where your product excels or needs improvement.
Usability Testing and User Behavior Insights
UXTweak goes beyond surface-level metrics by diving into the "why" behind user behavior. Through detailed session recordings, the platform highlights friction points that might not show up in traditional analytics. For example, a SaaS team used UXTweak to compare their onboarding process with a competitor’s. By analyzing session recordings and heatmaps, they discovered a confusing form step that caused users to drop off. After redesigning the form, they saw a 20% increase in onboarding completion rates.
Data-Driven Design Improvement Features
The platform’s analytics dashboard offers tools like conversion funnels, click maps, and journey analysis, blending quantitative data with qualitative feedback. This combination helps teams identify and prioritize design updates that improve user experience and drive conversions. With its ability to capture thousands of user interactions, UXTweak ensures design decisions are backed by solid, statistically meaningful data.
Collaboration and Prototyping Tools
UXTweak also supports team collaboration with features like shared workspaces, real-time commenting, and centralized reporting. It integrates smoothly with popular design tools like Figma, enabling teams to test and refine new ideas effortlessly. Pricing starts at $80 per month, with a free plan available for smaller teams. Consistently rated 4.7/5 on major review platforms, UXTweak is an affordable and effective choice for teams looking to elevate their UX research process.
FAQ: UX competitor analysis tools
One thing worth repeating before the questions: tools surface symptoms; they don't decide priorities. The teams that get the most from competitor analysis use it to answer a single question — where is our product losing people, and what's the one fix that helps most?
How can UX competitor analysis tools help improve user retention and conversion rates?
UX competitor analysis tools are a goldmine for understanding what clicks (and what doesn’t) in your competitors' user experiences. By pinpointing their strong points and areas where they fall short, you can discover ways to improve your own product’s usability, simplify user flows, and tackle common pain points head-on.
What key features should I look for in a UX competitor analysis tool to ensure it fits my team's needs?
When selecting a UX competitor analysis tool, it’s important to match its features with your team’s objectives and daily processes. Tools that provide insights into user behavior - like heatmaps, session recordings, and funnel analysis - are invaluable for understanding how users navigate and engage with competitor platforms. Features for competitor benchmarking are equally important, as they allow you to compare critical metrics such as load times, engagement levels, and conversion rates.
How do tools like Userlytics and Semrush streamline design and marketing workflows to improve UX strategies?
Tools like Userlytics and Semrush help sync design and marketing work. These platforms provide insights that help refine user experience strategies and make collaboration between teams smoother.
How much should a small team budget for UX competitor analysis tools?
It varies widely. Budget-friendly options like UXTweak start around €92/month and cover usability testing, heatmaps and benchmarking — enough for most small teams. Figma has a free tier for the design side. Enterprise platforms like Contentsquare or Userlytics run into custom, four-figure pricing and only pay off at scale. Start with one tool that answers your single biggest question, not a full stack.
Do I still need a UX audit if I already use these tools?
The tools give you data; an audit turns that data into a prioritized plan. A platform can show you a hundred friction points — it won't tell you which one is costing you the most users or what to fix first. A focused UX audit reads your product from the outside, ties each issue to a business impact, and gives you a short, ordered list of what to do. Tools and an audit work best together.
How often should I run UX competitor analysis?
Treat it as a recurring check, not a one-off. A deeper competitor review once or twice a year catches market shifts; lightweight monitoring (traffic trends, a quick session-replay scan) every quarter keeps you from drifting. Always run one before a redesign or a major release, so you're deciding with current evidence rather than last year's screenshots.
What is AI UX competitive analysis?
AI UX competitive analysis uses large language models to speed up the comparison of competitor user experiences: summarising review complaints, describing flows from screenshots, and drafting heuristic evaluations. The AI does the first pass; a designer verifies the findings against real behaviour data before anything changes.
Can AI replace UX competitor analysis tools?
No. AI is good at the first pass: describing flows, summarising complaints and drafting comparisons. The tools in this list supply the evidence that keeps the analysis honest, from session recordings to test results. The strongest workflow pairs the two.
Not sure which friction to fix first?
A tool shows you where users struggle. A Bottleneck Audit tells you which problem to fix first and what it's worth — a focused outside read of your product in days, not months. It's how we helped teams turn a messy product into a clearer one users actually adopt (see how that played out in one product). Discuss your product in a free 30-minute call →
Related reading
Let’s create something greate together
.svg)